


Blog by: Sheetal Patnaik
Still, breaking your head to evaluate the performance of your model? Lets go through some basic machine learning metrics.
Why Machine Learning Metrics 🤔?
Continuous observation of the assumption builds up a machine learning model. Once it's built, the performance is observed and evaluated continuously, which further results in a desirable accuracy. The main motive should be to go along with the constructive feedback principle that helps to create a model that gives high accuracy on the given sample data. Hence, it is vital to check the accuracy of your model before computing predicted values. In a general sense, model evaluation metrics are used to explain the performance of the model. The nomination of a metric ultimately depends on the type of model and the implementation plan of the model.
Now, talking about the evaluation metrics. The two most important types of evaluation metrics are:
1.Regression
2.Classification
Regression⚒️:
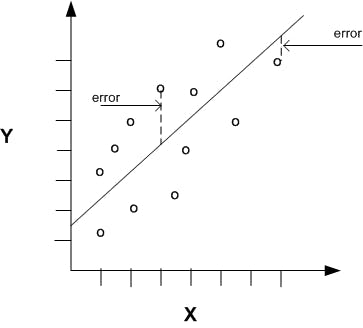
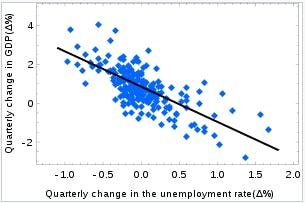
It is a form of predictive machine learning technique which scrutinizes the relationship between a dependent(target) and independent variable(s)(predictor). Here, we fit a curve/line to the data points so that the differences between the distances of data points from the curve or line are minimized.
Let's give a glance at the famous metrics used in Regression:
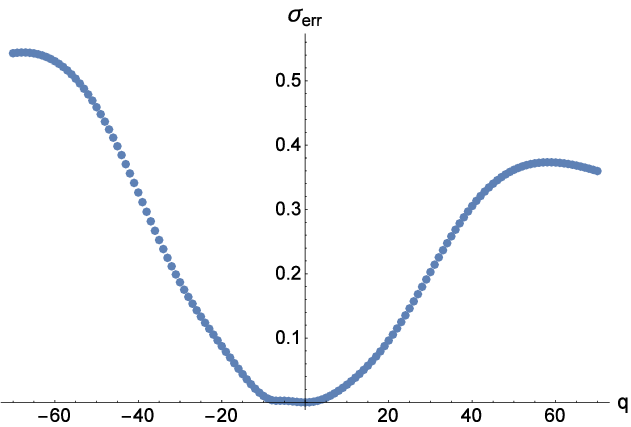
1.Root Mean Squared Error: Root Mean Square Error (RMSE) is a standard way to measure the error of a model in predicting quantitative data. These prediction errors are sometimes called Residuals. Residuals are basically the measurement of the distance of data points from the Regression line. Formally,

Where
1.Σ = summation (“add up”)
2.(yi— yj)^2= differences squared
3.N = sample size
RMSE is a good estimator for the standard deviation σ of the distribution of our errors! Here is the graph:
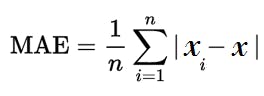
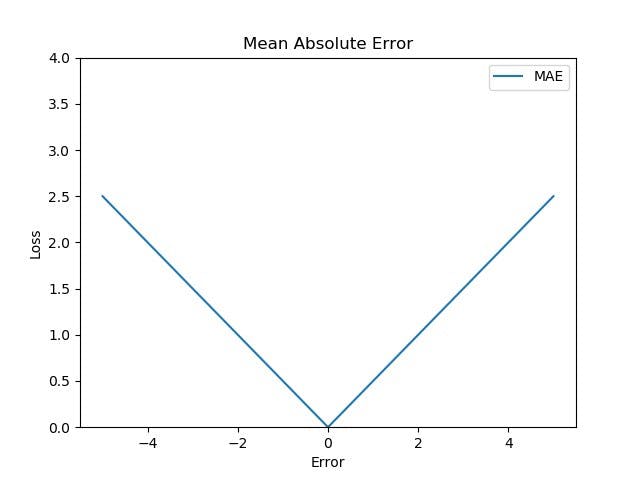
2. Mean absolute error:The average taken between the original values and predicted values is called Mean Absolute Error. It also measures the average magnitude of error, i.e., how far the predictions from the actual output. Moreover, MAE does not provide us any direction of error, i.e., whether we are overfitting the data or underfitting the data. Formally,
Where
MAE=mean absolute error
x_i=prediction value
x=true value
n=sample size
Here is the graph:
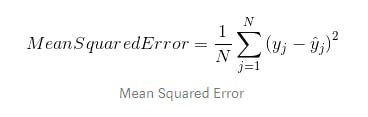
3. Mean Squared Error: It takes the average of the square of the difference between the original values and the predicted values n. Formally,
Where
n=sample size
y_j=the vector of observed values of the variable being predicted
ŷ=the predicted values
Here is the graph:
4.R Squared:R-squared is a statistical measure of how close the data point is fitted to the regression line. It is also known as the coefficient of determination. R-Squared is defined by the explained variation divided by total deviation.
R-squared = Explained variation / Total variation
R squared cannot determine whether the coefficient estimates and predictions are biased. So Adjusted R squared comes into the picture. Basically explains regression models having multiple independent variables or predictors. Formally,
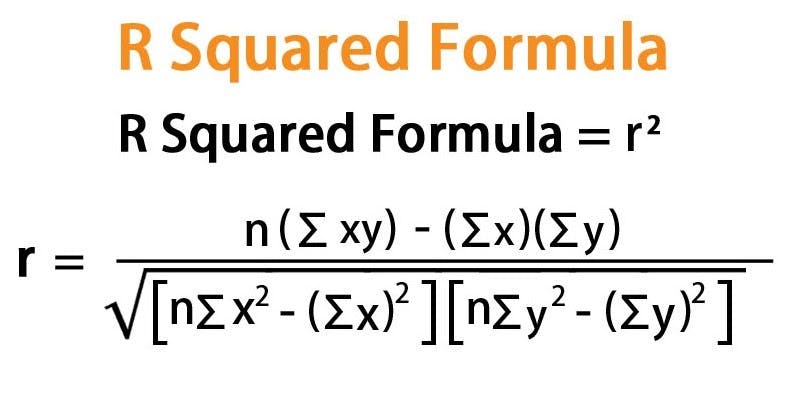
Where
N = No of scores given
∑ xy = sum of paired product
∑ x = X score sum
∑ y = Y score sum
∑ x^2 = square of X score sum
∑ y^2 = square of Y score sum
Here is the graph:
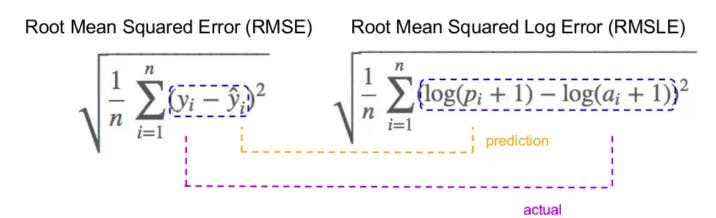
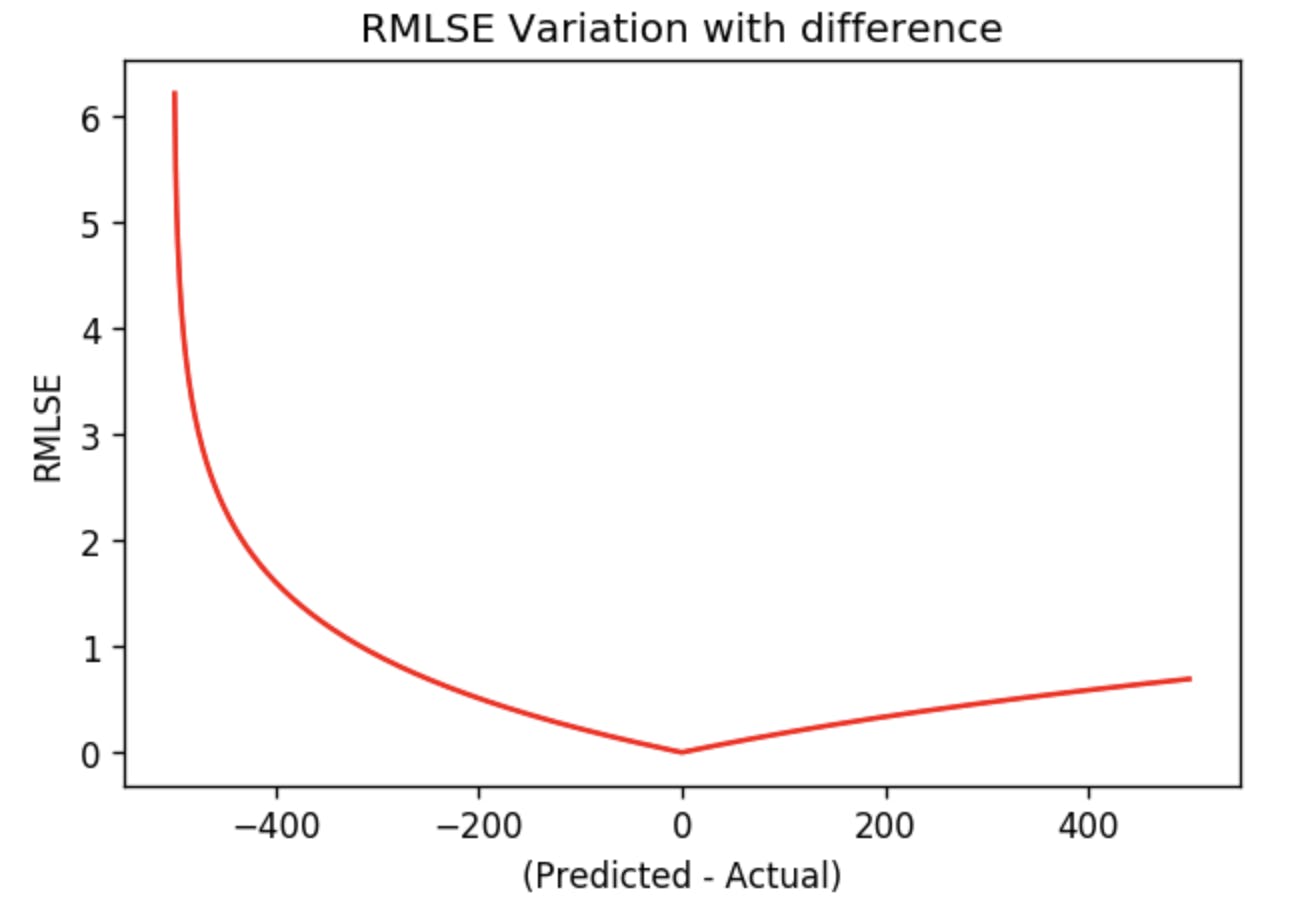
5. Root mean squared logarithmic error : It is a technique to determine the difference between the values predicted by a machine learning model and the actual costs. The log of the predictions and actual values is to be taken here. Formally,
 Where
Where
pi=the prediction value
ai=the actual value
n=no. of samples
Here is the graph:
Classification⚒️:
As the name itself suggests, it is the task of "classifying things" into sections. But, by a machine! If that doesn't sound like much, imagine your computer being able to differentiate between you and a stranger. Between a potato and a tomato. Yeah. It sounds interesting now.
In Machine Learning, Classification is the problem of identifying to which of a set of sections a new observation belongs to, based on a training set of data containing observations and whose categories membership is known. The following are the types of evaluation metrics for classification:-
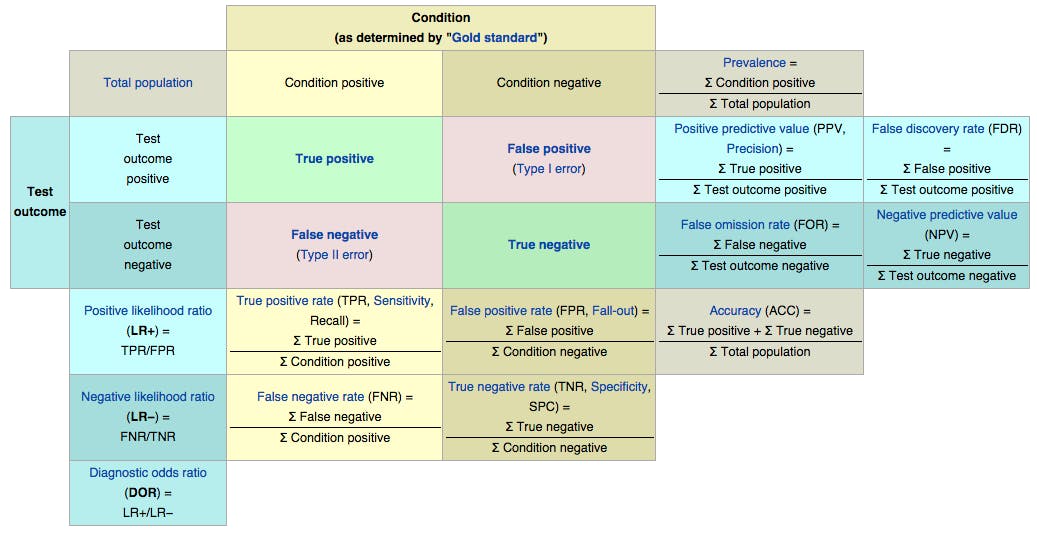
1.Confusion Matrix:A confusion matrix is a table that outlines different predictions and test results and contrasts them with real-world values. It is used to describe the performance of a classification model over a set of given data sets for which valid values are known.
A confusion matrix can also be called an error matrix. Mostly, it is used for an in-depth analysis of statistical data efficiently and faster analysis by using data visualization.
Confusing??? Get to explore them.
1.Accuracy: The percentage of the total number of correct predictions.
2.Positive Predictive Value or Precision: The percentage of positive cases that were correctly identified.
3.Negative Predictive Value: The percentage of negative cases that were correctly identified.
4.Sensitivity or Recall: The percentage of actual positive cases that are correctly identified.
5.Specificity: The percentage of real negative cases that are correctly identified.
2.AUC-ROC(Area under ROC curve):It is a graph showing the performance of a classification model at all classification thresholds. The ROC curves plot the graph between True positive rate and false-positive rate.
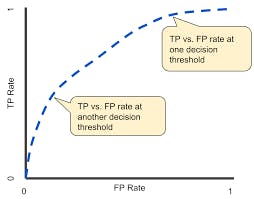
AUC is an acronym for the area under the curve. It computes the entire 2D area under the ROC curve.
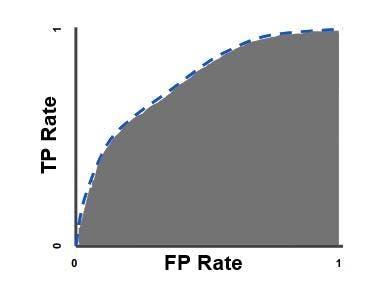
It always focuses on the quality of the model's skills on prediction irrespective of what threshold has been chosen.
3.F1 score:It is the harmonic mean for precision and recall values. The formula for F1 score goes this way
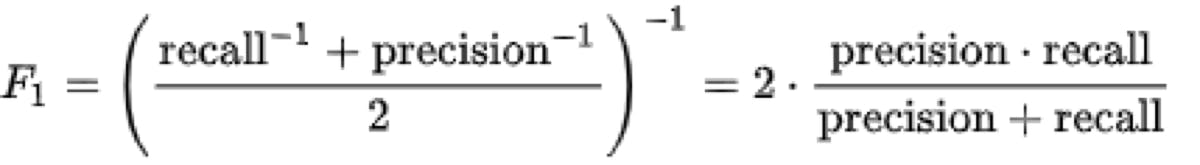
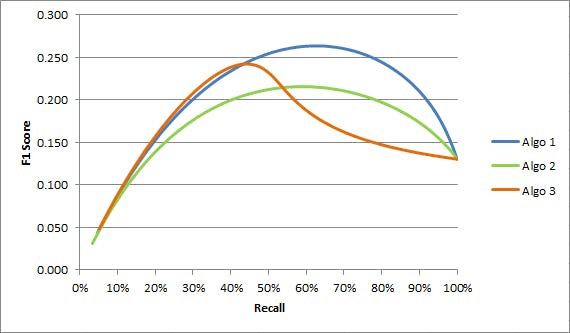
This publishes the most extreme values wherein the higher the F1 score more is the predictive power of the classification model. A score close to 1 means a perfect model; however, a score close to 0 shows decrement in the model's predictive capability.
Graphically,
Hence, evaluation metrics are used to quantify the quality of model. The higher the performance, the better the model. This is essential for any machine learning project. So, create the above and make a more significant impact with conventional accuracy.